In this post, I’m doing a review of the Advanced WPF Application Performance Tuning session of PDC09.
1. Introduction
WPF = Designer + Developer:
- Designer: Resources constraints, Drawing effects, Excessive use of images, “Rich” template
- Developer: Loaded modules, Startup time (cold and warm time), Memory leaks (it’s not because we have a GC that leak doesn’t exist), Large element count
Performance general truth:
- Measure, measure, measure (identify key scenarios and set clear goals)
- Low hanging fruit: identify parts that need optimized (to avoid spending time on optimizations that will not be perceived by the user)
- Perceived performance is the most important thing: make it feel fast
- Trade-offs: CPU vs memory…
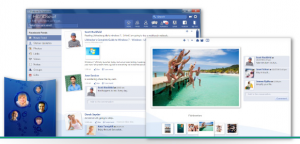
After this short intro, the speaker introduce FishBowl a sample WPF application that brings Facebook on our desktop. This app will be used as a reference in the rest of the session to demonstration optimization techniques.
2. Memory usage
The demonstration starts using Process Explorer to have a look at the memory usage of the app which is about 150MB. This seems quite high for such an application. By using VMMAP, the speaker finds out that the native heap is 100MB whereas the managed heap is only 50MB. This seems strange for a pure WPF application.
There is always native heap (render thread…), but when it’s particularly large, it’s generally related to images used in the application.
By browsing the source code of FishBowl, the speaker shows that the startup animation is not XAML based but uses more than 100 PNG images holding more than 30MB of memory (that will be in the native heap).
Using .Net memory profiler, the speaker finds out that the bitmap images used in the startup animation are not released when the animation is over causing a memory leak.
3. Cold Start
Cold start is all about disk I/O, we must minimize the amount of data that must be read from disk. The speaker shows that System.Window.Forms and System.Drawing assemblies are loaded during startup whereas it should not be the case for a pure WPF app (and about 300ms could be saved).
Then using the “Show hierarchical” feature of the .Net memory profiler, he finds out that System.Drawing only has 1 instanciated type (the Rectangle class !). By changing the code to remove those dependencies he prevents those 2 DLLs from loading in the startup process and improve the startup time !
Although by changing this code:
if(Properties.Settings.Default.EnableLoggin)
{
  // LogEntry is defined in the Entreprise Logging Library DLL
  // and use this class will cause the assembly to be loaded
  var entry = new LogEntry();
}
Into this one:
if(Properties.Settings.Default.EnableLoggin)
{
  // the previous code has been moved to a dedicated method
  this.LogMessage();
}

[MethodImpl(MethodImplOptions.NoInlining]
private void LogMessage()
{
  // code that uses LogEntry and needs to load the Loggin assembly
}
We can prevent the DLL from being loaded when the loggin option is not enabled ! Notice the MethodImpl attribute that prevents the compiler from inlining the method (which would take us back to the original code…)
4. Warm start
During warm start we’re not expecting to see as much I/O as during cold start. The first tool that should be used to analyze warm start is a CPU profiler.
In the FishBowl app, the main ListBox does not have virtualization turned on because each item has a variable height which cause a hang in the startup process. In order to improve the experience of the user, the app has been updated to load the elements in a background thread.
The real performance is not changed here, but the perceived performance for the user is much better because he has a visual feedback instantly !
5. RunTime
Using WPFPerf, it’s possible to find out what the CPU usage is (between animation, layout, rendering…). The perforator tool gives various graphs such as Frame Rate, Software and Hardware IRTs (Intermediate Render Target).
Currently if a Rectangle has DrapShadowEffect with an Opacity of 0, it is still computed by the rendering thread (it could be an optimization that WPF does internally but it’s not yet the case) which can cause performance issue when the parent item is animated.
A possible optimization is to split the Rectangle into 2 Rectangles:
- the first one with the effect and an opacity of 0 (on the Rectangle itself not on the effect like previously)
- the second one without any effect and an opacity of 1 (visible), a storyboard is set on this rectangle to make the first element visible by animating its opacity
In this case, because the first Rectangle is hidden (Opacity = 0), the cost needed to animate this rectangle is much better.
Aditionnal recommendations:
- don’t block on the UI thread
- use virtualization, if you can’t use it, improve the perceived performance by loading the items in a background thread
- data virtualization
- freeze your freezable !
6. Summary
- Memory: images size, memory leaks, elements count
- Cold start: disk I/O, module loads, NGen
- Warm start: avoid blocking, delay work, perceived perf
- RunTime: beware of IRTs, eventing
7. Tools
- Process Explorer in order to know how much memory has been allocated
- VMMap where the memory is going ? (native head, managed heap…)
- .NET memory profiler the profiler that is being used by the WPF team internally at Microsoft
- ETW: event tracing
- WPFPerf: WPF performance analyzer


Really helpful session, thanks for concentrating on performance part of WPF Applications.